 Create an Account
 Login/myAPPA
 Bookstore
 Search
  Translate
Since the 1600s, organizations have used financial and nonfinancial information for managerial decisions.
Managers used financial accounting data mainly to control individual and production unit work until the 1950s, when they also began applying data to enterprise financial planning. The resulting management accounting reports are based on manager data needs and enterprise objectives and are more subjective and more flexible in format than audited financial reports.
Nearly all facilities management problems involve alternatives (often with subsidiary choices), and their costs (e.g., initial, operating and maintenance, life expectancy, replacement, time value of money) must be compared to justify decisions and budgets, recognizing that imperfect alternatives are sometimes the most economical.
Control and Analysis Concepts
Principles of Financial Controls. Financial controls are emphasized by the Sarbanes-Oxley Act (SOX), which focuses on publicly traded firms but indirectly affects universities (e.g., similar state legislation and, more important, financial auditing firms examining their roles more closely). Key board of director fiduciary responsibilities are strategic direction, stakeholder protection, monitoring of financial health, and auditor evaluation; SOX also imposed personal responsibility and liability on board members. Internal controls are a collection of processes performed daily to give reasonable assurance of operational efficiency and effectiveness, financial statement reliability, and legal and regulatory compliance; they should be a means, not just policies and procedures, and integral to every aspect of the business and built into business processes. Internal financial control keeps an organization on course, plays a critical role in mission achievement, minimizes surprises, improves responses to a changing environment, and provides a standard for assessment and improvement. Financial control and planning are virtually inseparable.
The COSO integrated internal control framework has served many industries since its creation in 1992 (and updated in 2013); it uses a three-dimensional internal control cube (see Figure 1.12). The first dimension has three categories of objectives (operations, reporting, compliance), with a financial statement to disclose to auditors significant internal control design deficiencies, material weaknesses, significant changes, and fraud. The second dimension relates to internal controls, such as (1) control environment (e.g., ethics, management philosophy, organization structure, authority and responsibility, HR policies and procedures, audit committee, codes of conduct and ethics, and conflict of interest statements); (2) risk assessment to identify and analyze key process risks, such as common strategic risks, universal business risks, and risk management (accept, avoid, reduce, share; easily examined by plotting probability of occurrence against impact levels); (3) preventive or detective control activities, policies, and procedures created to mitigate risk and achieve objectives; (4) information and communication, implying timely, accurate, current, and accessible information that must be identified, captured, secured, and communicated in a useful form and time frame; and (5) monitoring activities to assess system performance quality over time. The third dimension deals with applying previous criteria to every organizational sector and activity to support processes.
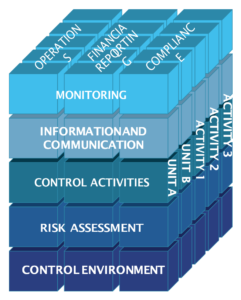
Figure 1.12. COSO Framework: Three-Dimensional Criteria for Evaluating Internal Controls
Control. To control it is necessary to have a way to measure performance and a standard to which performance is compared. Cost accounting systems measure performance cost, most commonly present- versus-past and actual-versus-budget comparisons.
Even basic accounting systems enable present-versus- past comparisons, whose usefulness is enhanced with performance trend lines over time periods, but such comparisons should be used with caution and skepticism and preferably in conjunction with other indicators because there is no indication what performance should have been. Actual-versus-budget comparisons, perhaps the most important facilities manager technique, are superior to past comparisons because of budgets in general and the unique role they play in monetarily embodying the plan to meet objectives. For nonprofit organizations, budgets play an even more important role in management control because of the absence of profit as a criterion, so the cost accounting system must be designed to be consistent with the budget.
Types of Analysis. Many analysis types give insight into management effects on financial performance. (1) Comparative analysis maps internal objectives to those of similar schools but suffers from inconsistent interinstitutional data, past performance measurements, and use of indexes or ratios rather than more meaningful trend lines and charts. Every year, APPA surveys its members and publishes the results in its Facilities Performance Indicators report (FPI), so that managers can compare performance across institutions of similar size, type, and purpose. Some trade journals periodically publish information (not as comprehensive as APPA data). Published indicators only serve as a guide; the often large differences among institutions reflect differences in costs and methods of accounting. Benchmarking is a better approach to comparative analysis. (2) Constant-dollar analyses (e.g., Higher Education Price Index) indicate the impact of inflation on budgets and can be used to develop institution-specific cost indexes. (3) Performance analysis creates frequently nonused monetary standards against which actual performance can be measured and compared, complementing budgets and helping to build budgets. Performance standards can be external or internal; the latter usually relate to the budget or unique goals and objectives of departments. (4) Ratio analysis uses trending ratios of key financial indicators (e.g., current or long-term asset or liability, fund balances, return on investment, creditworthiness,) to determine their stability. (5) Variance analysis focuses on deviation from a standard (e.g., historical or comparable-institution data). The two variance types are price and quantity. (6) Exception analysis focuses a manager’s attention on the relatively small number of items where actual performance differs significantly from the standard, ignoring relatively numerous minor variances or leaving them to lower-level accounting managers. Management by exception is based on Pareto’s law, also known as the 80-20 rule (80 percent of any result is controlled by 20 percent of whatever is producing the result).
Concepts in Finance
Analysis and interpretation of accounting data for decisions requires a basic understanding of finance.
Time Value of Money. When a facilities manager evaluates alternative solutions, dollar values must be comparable, so interest must be computed. Simple interest is paid at the end of a specified period based on total amount owed at the end of the previous period and usually applies to loans of a year or less. Compound interest, the standard business practice, also is based on total amount owed at the end of the previous period but includes both original principal and accumulated interest.
Risk and Return. Defined as probability of an unfavorable outcome occurring, risks are either systematic (attributable to causes that simultaneously affect the general market) or unsystematic (unique to industry or institution). Systematic risks are subdivided into operating, financial, market, and purchasing power risks. Risk and return are closely linked, so one cannot be calculated without the other. Return is defined as a benefit received because of an incurred cost. The chapter includes formulas for rate of return and for whether capital investment rate of return is sufficiently high to compensate for risks and pure interest rate.
Financial Planning and Control. Managers must decide on financial alternatives to complete a jobs cost- analysis effectively (e.g., in-house versus contract services, equipment purchases, utilities generation versus purchase, computer leasing or purchase, and frequency and quantity of stock item orders).
Break-Even Analysis. One financial alternative decision technique is break-even analysis, and another method is economic order quantity (EOQ).
Financial Forecasting. An important financial ratio, financial forecasting, assesses how changes in external factors affect financial health. The key to financial forecasting is the ability to project factors for a period of five years or more with a reasonable degree of accuracy. Statistical methods (e.g., scatter diagrams, regressions, etc.) offer insights to determine if the relationship between the external factors and the resulting financial impacts are linear, curvilinear, cyclical, or simply the result of temporary fluctuations in external conditions.
Debt Financing. Short-term and long-term debt financing for capital projects is common. The key factors in selecting a short-term source are effective cost and availability of credit. Facilities managers most commonly encounter financing of long-term debt, and use bond financing. For either short-term or long-term debt, institutions hedge principal (long-term debt for permanent assets; short-term for temporary investments).
Bond Evaluation. A bond is a long-term promissory note issued by a federal, state, or local government or an individual firm, usually for more than 10 years and in denominations of $1,000, with either a par value (face value at maturity), market value (varying by interest rate), or coupon interest rate (percentage of par value paid to bondholder annually). A bond rating is a debt quality measurement based on subjective and objective assessments of risk associated with timely payment; it supports the setting of bond price and fixed rate of return. Bond rating agencies review financial ratios and perform thorough analyses.
Capital Budgeting Techniques. An important plant management function, capital budgeting deals with planning the investment in a fixed asset when the expenditure and expected return of the asset extend beyond a year; changing decisions will be costly; and investment size usually requires careful analysis. (1) The payback method determines number of years over which the initial capital outlay will be recovered, accepts a project if payback is less than or equal to a set period, offers a simple method emphasizing more certain early-year cash flows, does not account for time value of money or revenues beyond payback years, but is useful for prescreening. (2) Net present value (NPV), accumulated future project contribution to the institution minus initial capital outlay, discounts every year’s profit using the present value technique and is usually set by the school as opportunity cost of capital, allows projects with an NPV greater than zero to proceed, usually favors projects with the highest NPV, and is preferred to payback despite discriminating heavily against options with big revenues in out-years and assuming project- created cash flow can be invested almost instantaneously at the discounted rate. (3) Internal Rate of Return (IRR) uses an NPV of zero to calculate project discount rate, accepts a project if that discount rate is equal to or greater than the institution’s discount rate, favors project alternatives with the highest IRR, and is better than NPV despite the greater difficulty of calculating the result. (4) Third-party financing has become viable since the mid-1980s for capital outlay projects such as central utilities and energy (and central plant projects other than or combined with cogeneration) and often requires facilities manager input for a contract between the university and the third party. Third party financing uses independent financing companies and equipment vendors to fund more energy-efficient hardware, but has problems determining and divvying savings from modifications and is usually less attractive to nonprofit groups because tax advantages most often do not apply.
Productivity Measurements
Since the 1970s, continuous and quality improvement practices have brought scrutiny to management accounting; many observers concluded that accounting data after World War II produced a distorted picture of many businesses, contributing to declining competitiveness and profitability of U.S. firms.
Traditional department-level cost management systems do not provide needed analytical tools to identify improvements in cost-effectiveness of administrative and support processes; usually are inflexible; focus on short-term considerations; have an affinity for suboptimal solutions; and fail to eliminate root causes of inefficiencies and non–value-added activities. Management accounting emphasizes process and activity cost and performance measurements for quality attributes (e.g., customer satisfaction, reliability, cycle time, flexibility, productivity). Key elements are continual involvement in management-level activities and understanding of critical business success factors (e.g., customer markets, technology, and provided services). These needs triggered development of Activity-Based Costing (ABC) in the 1970s and then Activity-Based Management (ABM), a continuous improvement accounting system.
Activity-Based Management. ABM assumes that productivity and cost are too complex to know or control by referring to management accounting reports, so institutions must track costs in relation to activities performed. ABM makes a distinction between use of resources and spending on resources (cutting one without reducing the other will not affect the bottom line), an important concept now, when overhead costs often are an ever-increasing percentage of total cost.
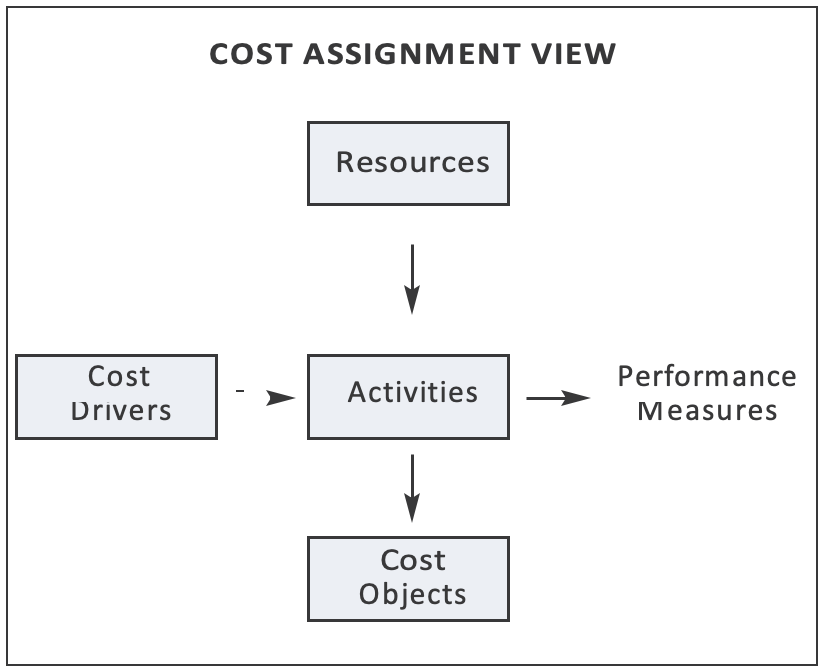
Figure 1.13. Cost Assignment and Process Views
ABM cuts across functional areas depending on specific processes and is two-dimensional, with a process view (linking series of goal-related activities) and cost assignment view (resources consumed by activities based on resource drivers, the factors that determine workload and effort). Performance measures are derived from institutional vision and objectives; an excellent model is the balanced scorecard, which assigns four dimensions (financial, customer, and internal perspectives; organizational learning) to institutional objectives. All activities are part of a customer chain. After defining activities, ABM conducts a value analysis for all activities (divided into essential, incremental, sustaining, and waste activities). ABM does not attain the same level of precision as financial reports, but should be reasonable for decision-making. Organization core processes normally fall into three categories: human, information, and material processes (see Figure 1.13).
Leave a Reply
You must be logged in to post a comment.