 Create an Account
 Login/myAPPA
 Bookstore
 Search
  Translate
Introduction
TopThose charged with developing and preparing a facilities management department budget will benefit from understanding how issues facing higher education have affected facilities management over the past several decades. More recent external environmental factors, from the recession in 2008 to the COVID-19 pandemic, have contributed to an era of reduced funding that has led to staffing cuts, new working environments, and uncertainty about the future. Still, the truth is that higher education had been on a collision path with fiscal uncertainty long before that. Our current budget models reflect how our institutions have handled these challenges and changed our budgeting practices.
Many institutions experience financial stress due to higher operating costs, thanks to students’ inability or unwillingness to pay for additional tuition increases, combined with the cost of deferred maintenance backlogs, the reduction of state funding, inflation in salaries and materials, and the decline in institutions’ ability to sustain alumni giving.
Operations must become more businesslike, more competitive, and more focused, with simpler organizations and a greater ability to invest in programs that support the principal mission of the institution. Managers should adopt goals for their departments that are consistent with those principles.
The Rising Cost of Education
TopThe cost of education has risen exponentially in the last two decades. In an article by E. Kerr and S. Wood, “A Look at College Tuition Growth Over 20 Years,” (U.S. News & World Report, 2023, September 13), the authors illustrate 20 years of tuition changes as reported by the 440 ranked U.S. universities included in the 2022-2023 Best Colleges rankings. Between 2004 and 2023, tuition and fees at private universities jumped 134%, out-of-state tuition and fees at public universities rose 141%, and in-state tuition and fees at public universities grew the most, increasing 175%.[1]
The cost of education rose disproportionately compared to other indices and inflation. According to the United States Bureau of Labor Statistics CPI Inflation Calculator, the cumulative inflation rate was 64.65% for the same period.[2]
The resulting pressures to make college education affordable during a time of rising costs have stressed institutional budgets—facilities budgets specifically. This is true for both public and private institutions.
“The Lattice and the Ratchet”
A prescient warning was sounded in an often-cited article entitled “The Lattice and the Ratchet” that appeared in the June 1990 issue of Policy Perspectives, a publication issued under the Pew Higher Education Research Program and sponsored by the Pew Charitable Trusts.[3] The article, by a broad cross-section of higher education leaders, described why the cost of education was skyrocketing and what might be done to develop a “framework of redesign.” Although written over 30 years ago, “The Lattice and the Ratchet” remains relevant today.
The Administrative Lattice
The Policy Perspectives article attributed a portion of these higher costs to the “administrative lattice,” a term used to describe the growth in colleges’ administrative functions during the preceding decade. Data indicated that administrative positions at colleges and universities grew by more than 60 percent between 1975 and 1985, 10 times the rate of faculty growth during the same period.
This increase in administration size was attributed to three factors: administrative entrepreneurism, governmental regulations, and consensus management.
The Academic Ratchet
Faculty members were the primary beneficiaries of this growth, as much of their workload moved to the administration. Their traditional roles changed rapidly from being all-purpose teachers, advisors, counselors, and job placement specialists to instructors, researchers, and consultants. Professional pursuits such as consulting and research, in turn, reduced time in the classroom and created personal objectives that led to a desire to teach at convenient times. These changes had a ratcheting effect that kept increasing the buildup of administrative functions.
For example, faculty desire for more convenient teaching times led to additional class hours in the middle of the day (the period schedulers call “prime time”). With a finite number of classrooms for any given period, concentrated scheduling increased demand for teaching space that was usually met by new facilities. The “care and feeding” of these new buildings added to budget strains.
What’s more, new construction also helped lead to an ongoing backlash toward new space on campus. Many states have initiatives that limit new construction in higher education. Some ban new space altogether, while others have strict space reporting requirements.
Continued Pressures
Perhaps that 1990 article sounded an early warning call to colleges and universities, but it wasn’t the last. According to the authors, “What is clear is that the challenge facing higher education is no different than that facing most American enterprises. The nation’s colleges and universities need to become more competitive—leaner, perhaps meaner, certainly more focused, with simpler organizations and a greater ability to make collective investments in targeted programs and projects.”
There was more to come. Much more.
Recession of 2008
During the Great Recession of 2008, state support for higher education declined as the change in economic conditions significantly lowered tax revenues, while the need for special funding of health care and social assistance increased. In an article for the Chronicle of Higher Education, “The Great Recession Was Bad for Higher Education. Coronavirus Could Be Worse” (March 24, 2020), Paul N. Friga wrote that state support for public institutions decreased from $82.2 billion in 2007-8 to $78.5 billion in 2008-9, a decrease of 4.5 percent.[4]
Generally, people return to school during a recession, but that was not the case this time, at least not immediately. There was an 18-month lag until unemployment benefits ran out. Tuition had increased due to a lack of state support, and students took out loans in historic amounts. Because the recession was relatively short, as the economy and jobs returned, many students dropped out without degrees. State support never returned to pre-recession levels.
The Tuition Ceiling
Raising tuition to cover the increased costs has just about reached the limit for several reasons. In a 2022 article for Inside Higher Ed, Josh Moody noted:
“Tuition increases are staying low for several reasons. The first is at many public universities, they aren’t being allowed increased tuition. The state Legislature or the state higher education agency just tells them no,” said Robert Kelchen, professor and head of the department of educational leadership and policy studies at the University of Tennessee at Knoxville. “Another factor is most colleges don’t have very strong market power to increase tuition right now. Enrollment across higher education is down, and they’re concerned that if they increase tuition, they’ll lose students to other colleges. And then the third reason is that colleges are trying to keep tuition increases as low as possible because they know that a lot of students are having a hard time affording college. If they increase tuition too much, students may not be able to continue.”[5]
Tuition costs had been rising to balance the three-legged funding “stool” (state funds, tuition and fees, and local funding). As state funds decreased, tuition and fees increased. As state funding and enrollment decreased further, it again forced an adjustment to tuition and fees to keep the stool level. The danger was that if the stool is not level, the institution could price itself of existence and relevance.
COVID-19
The full impact of COVID-19 will play out in higher education budgets for years. The immediate effects included lost tuition revenue when schools closed or went entirely online, increased costs related to additional cleaning requirements, and startup expenses for online classes. Additional impacts on operational costs came as institutions adopted different strategies, such as setting up tents for outside classes on campuses in moderate climates and modernizing and modifying air handling systems. Auxiliaries suffered financially, with fewer people living in residence halls and eating in on-campus dining.
On the other hand, the Coronavirus Aid, Relief, and Economic Security (CARES) Act of 2020 provided funds to institutions that offset some of these losses, and when activities began to normalize, many institutions benefited from reduced faculty and staff travel to conferences and training. Some universities have continued to impose more stringent approvals for training conferences.
The Great Resignation and Remote Work
Further, widespread job losses in the early months of the pandemic gave way to tight labor markets in 2021, driven in part by what many called the Great Resignation. The nation’s “quit rate” reached a 20-year high in 2022. A Pew Research Center survey in November 2022 found that low pay, a lack of opportunities for advancement, and feeling disrespected at work were cited as the top reasons why Americans quit their jobs. Those who quit and took jobs elsewhere were more likely than not to say their current job had better pay, more opportunities for advancement, and more work-life balance and flexibility.[6]
Another consequence of the pandemic has been a growing acceptance of remote work. Once technologies were developed and refined, the workforce collectively concluded that this desire for work-life balance and flexibility translated into a desire to work remotely. Jobs where remote work was impractical created challenges for many employers, particularly in higher education and especially for positions that revolve around personal interaction and physical contact—such as residence hall staff, project managers, and custodial and grounds employees. Staff who were not able to participate in remote work began to insist upon other ways to improve work-life balance, such as shortened work weeks.
These shifts have led to staff shortages at every level. In addition, with so many departing at once, the transfer of institutional knowledge has suffered. Work-from-home policies had to be created and implemented, and position descriptions re-written.
Strategies for Financial Stability
All these challenges have reduced revenues and increased operating expenses for educational institutions to unsustainable levels, leading many to take innovative and occasionally drastic measures to reduce costs and balance budgets. Here are some of those strategies.
Outsourcing and Monetization
Many institutions outsource facilities functions to providers that can deliver those services for less money. In the related shift to monetization, some third-party firms provide a cash infusion in return for taking ownership of an asset through a long-term operating agreement, thus monetizing the asset. Higher education institutions have implemented monetization agreements with utility systems, parking facilities, residence facilities, conference centers, golf courses, laundry operations, and even radio stations. Operating partners also typically assume the deferred maintenance burden, as depreciation is an available tool for a private, for-profit enterprise and not for educational institutions. These arrangements are commonly referred to as “P3s,” for public-private partnerships.
While some are controversial regarding their long-term viability, here are some examples of outsourcing and monetization:
Valparaiso University Utilities
Valparaiso received the APPA Effective and Innovative Practices Award in 2009 by turning its medium voltage and natural gas system over to the local utility in return for cash. The utility assumed responsibility for all deferred maintenance and signed a long-term operating agreement. While this award dates from 2009, it remains important from the standpoint that potential P3 partners saw it as a selling point for Valparaiso.
As published on the APPA website:
The documentation for the success of this project is twofold. The first is from
the annual Sightlines (now Gordian) report that demonstrates we have decreased our energy consumption and been able to reallocate labor. This was done in the same time frame that we brought online our new library at 105,000 sq. ft. and the new meteorology building at 16,780 sq. ft.[7]
Texas A&M System Maintenance and Operation
In 2012, the Texas A&M System awarded SSC and Chartwells a landmark contract to outsource all dining, custodial, grounds, and maintenance operations. According to the Texas A&M website, the agreement was intended “to produce $260 million in revenue and cost-savings for the A&M System while protecting the jobs of all current support services employees.”[8]
This agreement was subsequently expanded to all schools in the Texas A&M System, one of the largest higher education systems in the United States, with a $6.3 billion budget, 11 universities, eight state agencies, and 153,000 students. This was literally the “shot heard round the world” in facilities management outsourcing.
University of Idaho Steam Plant
In 2022, the University of Idaho leased its steam plant and utility system to a third-party concessionaire for an up-front payment of $225 million, which was to be invested in student success initiatives and growing revenues. Investing the net proceeds was expected to generate $6 million annually for strategic initiatives; some would be used to develop a capital plan and retire debt, with the remaining to be invested. According to the university website:
The Ohio State University and the University of Iowa have entered into these same kinds of agreements for their utility systems. Ohio State and Eastern Michigan have similar agreements for their parking assets, and the University of Georgia system and Purdue have monetized their student housing assets. According to a survey last year from The Chronicle of Higher Education and George Mason University, 83% of college leaders said P3 use is increasing on their campuses.[9]
The University of Iowa Central Plant
Not all these novel and innovative financing projects have been without challenges. In 2020, the University of Iowa entered a $1 billion public-private partnership to lease its utilities operations for 50 years, a deal that the state’s governor touted as innovative. According to Marcela Rodrigues in the Chronicle of Higher Education, the two parties to the agreement found themselves in court in late 2023 to resolve disputes.[10]
Results and Outcomes
Monetization of assets by higher education institutions is controversial, and a discussion of the advantages and disadvantages is beyond the scope of this chapter. As the last case illustrates, there can be significant issues and challenges with these complex arrangements.
Responsibility Center Management (RCM)
Responsibility center management basically turns many units into profit centers, directly impacting how facilities management is budgeted. According to a publication by the National Association of College and University Business Officers (NACUBO):
Responsibility center management—also known as responsibility center budgeting, revenue center budgeting, incentive-based budgeting, and value-center management—is a decentralized budget model and system used by many elite private nonprofit and large public research universities in the United States and Canada. Under RCM, financial authority is devolved from a central group of university leaders (known as central administration) to responsibility center leaders, such as academic and auxiliary units.[11]
The article identifies additional characteristics as:
- Responsibility centers own revenues and expenses.
- Deans and faculty are incented to be a part of success.
- Academic offerings are evaluated to align with enrollment.
- Extraneous budget items are scrutinized.
- Fund balances can be used to affect change.
In a NACUBO panel discussion, leaders at Iowa State University, Loyola University Chicago, and the University of Minnesota discussed their implementations of RCM and the reasons for adoption.
Iowa State University
Iowa State adopted RCM because of external factors such as declining student enrollment, increased competition, reduced state support, and slower growth in federal research funding. Internal drivers aimed to replace “top-down”/incremental decision-making, focus central decisions on strategic priorities, adopt an “all funds” approach to budget planning, empower colleges and departments to set academic strategies and fund initiatives directly with revenues they generate, and improve transparency and broaden understanding of budget decisions.[12]
Loyola University Chicago
Leadership at Loyola University Chicago stated that RCM would:
- Ensure that the university remains financially healthy
- Support long-term strategic planning by bringing visibility to the net result of each academic unit
- Enhance awareness of costs and opportunities to generate income
- Ensure university subsidies given to a particular academic unit reflected choice rather than historical performance
- Ensure that excess properties would be identified and sold, physical plant capacity consolidated, and operating costs reduced.[13]
University of Minnesota
The University of Minnesota said it adopted RCM to:
- Outgrow budget problems
- Improve transparency
- Improve accountability and management of resources
- Clarify the maze of cross-subsidies
- More clearly link performance to rewards.[14]
Strategic Sourcing
Strategic sourcing involves leveraging an educational institution’s overall spend with fewer suppliers and establishing contracts as the institution instead of by department, unit, or school.[15]
The University of California Irvine described its strategic sourcing strategy as involving “establishing relationships with suppliers who provide deep discounts on products and services. The leverage of the university increases as the spend on strategic contracts increases, creating the opportunity to increase and expand discounts, enhance service, and demonstrate to competitors the value of the contracts for the next cycle of strategic sourcing.” Benefits included improved negotiation power to reduce costs, improved contract and supplier performance management, and lower overall procurement process cost through fewer transactions that require the competitive bid process.[16]
Simply put, with strategic sourcing, a university’s total spend is analyzed across departments, and the total institutional purchases are leveraged to obtain discounts. For example, many different departments at a research university might purchase electrical or piping materials. These would all be purchased from a single vendor at a discount over the list price.
There are various scenarios for the distribution of the savings, many of which can have a significant impact on facilities budgets. In some instances, material is procured from a new supplier at an initially higher cost. Then, at a future point, the discount from the volume purchase is returned to the institution in the form of a rebate. If the discount is given to the department, then strategic sourcing delivers value to the units and represents departmental savings. In other implementations, the university retains the savings centrally, thus keeping the department budget level (or even increased) while passing the savings to the institution.
Chargebacks, Recharge, and Recovery
As budgets grew tight in the 1990s, state legislators began passing legislation and adopting statutes and administrative codes that required auxiliaries such as athletics, dining services, residential life, and golf courses to be financially self-supporting.
In conjunction with these requirements, facilities departments recognized that their funding was only for maintenance activities and began charging campus entities for non-maintenance work as well as tasks performed for auxiliary enterprises. These charges are known by many names, with chargebacks, recharge, and recovery being the most common. Additional information may be found in “Issues with Budget Recharge, Cost Recovery, and Rates,” a chapter in the APPA Body of Knowledge (BOK) that was a follow-up to an APPA Center for Facilities Research (CFaR) project.[17]
The Budget Process
TopFor information on capital budgeting, see the BOK chapter “Capital Renewal and Deferred Maintenance.”[18] While it is easy to think of “budget” from a purely financial aspect only, in practice, the budget represents the total resource allocation to a facilities department in terms of money, personnel, materials, and equipment. Facilities leadership must understand how budgets are constructed and be able to explain them to hold that proverbial “seat at the table.”
The basic principles of budgeting remain the same regardless of the approach employed. What’s critical is that budgets must reflect current economic conditions, and resources must be adequate to deliver the services demanded by the institution.
At larger institutions, the facilities department may have its own business office. At smaller colleges and universities, the central business office may manage the facilities budget. Other schools still have a shared services office to oversee the budgets of several departments, but regardless, it is critical that facilities leadership understand how the budget is prepared and develop a methodology to evaluate if their resources are adequate.
Approaches to Budgeting
General approaches to budgeting are frequently dictated by the institution. In the historical approach, the budget is based on the previous year and adjusted, with or without evaluating standards or performance. In zero-based budgeting, the budget is built (or rebuilt) from the ground up.
Regardless of the methodology, the basic principle underlying budgeting is planning. Facilities budgets are essentially constructed around personnel to perform the work, the material used to complete the tasks, and tools to execute the jobs. In an era in which every aspect of campus operations that affects budgets is changing rapidly, planning should be done in accordance with the strategic goals of the institution. The facilities budget should align with the university’s campus plans and goals and with agreed-upon standards of service.
Typically, the annual budget process begins with a review of the previous year’s budget. The university financial office asks departments to submit budget requests and adjustments. There are many ways to manage this process, but instructions are usually provided such that the total should increase (or decrease) by some amount, new money is (or is not) available to be asked for, and funds may (or may not) be transferred between accounts.
Three Generations of Resource Analysis
Throughout the year, facilities leadership should continually evaluate the existing budget to ensure that it is adequate to accomplish goals. If it is inadequate, facilities leadership must make the case to the administration that either more resources must be provided, or expectations should be lowered. Even when times are tough, the budget process is not all negative, and facilities should continually look at ways to improve operations. For example, a university facilities department could decide to increase staff to take on additional responsibilities that save money, as in the case of getting additional training so that backflow preventer inspections can be accomplished with in-house staff instead of being outsourced.
A presentation at the in 2023 reviewed the three generations of performance measurement and evaluation with respect to optimizing resource management.[19]
First Generation
The base level of performance measurement is asking the question, “Are our facilities expenditures comparable to peers?” This comparison may be made with reasonable accuracy, particularly if APPA Facilities Performance Indicators are used, but it does not reveal the performance outcomes of the activity.
Second Generation
At the next level, the question is, “Are we maximizing the resources committed to sustaining our facilities portfolio?” Compare measures with results and outcomes, such as facilities condition index per annual facilities operating expenditures per gross square feet and customer satisfaction per annual facilities operating expenditures per gross square feet.
Third Generation
At the top level, ask, “Can we make better operational decisions with our facilities data?” This is when goals are developed, and results are evaluated and modified until the desired results are obtained.
Targets for Performance
The next step in the budget process should be agreement on service levels. The starting point for any budget should be the expected outcomes as defined by the APPA Service Levels, defined for custodial, grounds, and maintenance in the Operational Guidelines trilogy and in the BOK. The resources provided should match expectations. (Note: The APPA Operational Guidelines Trilogy consists of Maintenance, Custodial, and Grounds. The “Trilogy” refers to all three, collectively.)
APPA service levels for custodial operations are:
- Traditional description: Orderly Spotlessness, Ordinary Tidiness, Casual Inattention, Moderate Dinginess, and Unkempt Neglect
- Additional description: Showpiece Facility, Comprehensive Care, Managed Care, Reactive Crisis
Each service level is associated with attributes (also referred to as characteristics). The levels in APPA’s Custodial Guidelines: Characteristics for Evaluating and Describing Levels of Custodial Cleanliness are shown below.
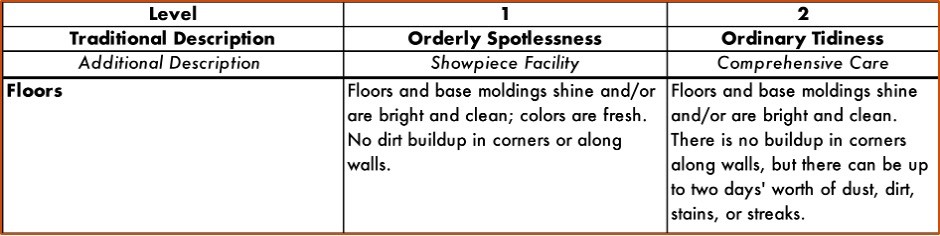
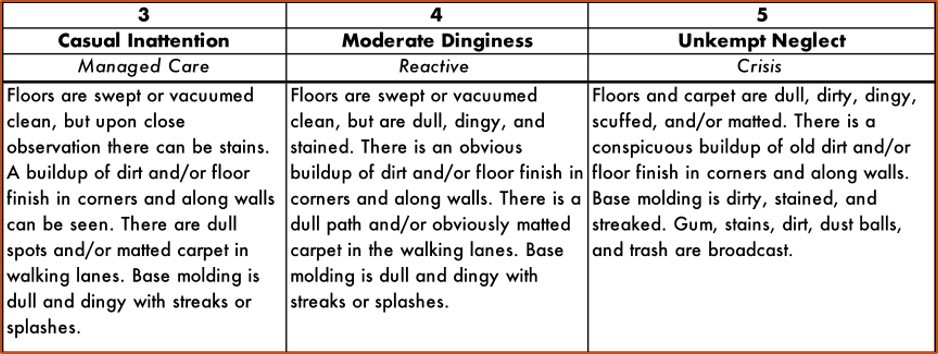
Figure 1: APPA Levels for Custodial Cleanliness
APPA service levels for grounds operations are:
- State-of-the-art maintenance. Applies to a high-quality, diverse landscape: Associated with high-traffic urban areas, such as public squares, government grounds, or college, university, or school campuses.
- High level of maintenance. Associated with well-developed public areas, malls, government grounds, or college, university, or school campuses. Recommended level for most organizations.
- Moderate-level maintenance. Associated with locations that have moderate to low levels of development or visitation or with operations that (because of budget restrictions) cannot afford a high level of maintenance.
- Moderately low-level maintenance. Associated with locations affected by budget restrictions that thereby cannot afford a high level of maintenance.
- Minimum-level maintenance.
Service levels for maintenance are described, with the associated customer service and response time:
- Showpiece facility: Able to respond to virtually any type of service, immediate response.
- Comprehensive stewardship: Responsive to most service needs, including limited non-maintenance activities, is typically in a week or less.
- Managed care: Services available only by reducing maintenance, with response times of one month or less.
- Reactive management: Services available only by reducing maintenance, with response times of one year or less.
- Crisis response: Services not available unless directed from top administration, none provided except emergencies.
Estimate Base Staffing and Budgetary Needs
Once service level targets are established, calculate the appropriate range of staffing and materials (resources) that match the desired outcome. APPA’s Operational Guidelines trilogy illustrates the detailed calculations for custodial, grounds, and maintenance functions. There are many ways of structuring the utilities organization, and APPA’s Facilities Performance Indicators (FPI) provides performance data for these comparisons.
The Operational Guidelines trilogy further breaks down custodial, grounds, and maintenance staffing into specific skills, such as irrigator, floor specialist, electrician, plumber, etc., and details how to calculate how many positions of each skill set are required to achieve the desired service level.
The Process Simplified
Ernest R. Hunter Sr. provided a holistic overview of the process in “APPA’s Operational Guidelines for Educational Facilities: A Focus on Staffing” in Facilities Manager magazine in 2018, as demonstrated in Figure 2 below. [20]
Figure 2: Courtesy of Facilities Manager magazine
Institutional Budget Elements
Staffing, materials, and utilities budgets are the mainstay of a facilities operating budget, but certainly not all the components. Other characteristics of an institution dictate the physical organization of the facilities management unit, which in turn impacts staffing and resource levels. All these attributes factor into budget requirements. The following elements may or may not be included in any given facilities budget.
Overhead
Overhead relates to costs that are not directly related to operations. Examples are exempt personnel in management, supplies, insurance, and training. Institutions have many ways of budgeting for overhead, and facilities leaders should become familiar with how this is budgeted for their department at their campus.
Business Services
As mentioned, the facilities department has its own business services unit at many campuses, while these services are provided centrally at others. A separate business unit is generally helpful since facilities has many unique operating nuances; however, it may also be more costly to the institution, at least initially.
Utilities
Utilities are budgeted differently depending on institutional operating characteristics. There is a particularly wide range in how this is accomplished; some schools have generation or cogeneration of electrical power, and most have heating and cooling either centrally or in groups of facilities. Many institutions own their electrical distribution systems. There are so many different strategies and systems that staffing calculations generally depend on the user, and it is best practice to compare utilities operations with others through the APPA FPI.
Many schools bill all departments for utilities; in other cases, auxiliaries or athletics may pay their own utility bills directly.
Project Group
Institutions have nearly as many ways of structuring small remodel and construction projects as there are universities, and a full discussion is beyond the scope of this chapter. However, every organization must budget for a methodology to provide these services.
Some schools charge fully loaded rates for construction services, while others simply provide minor projects at cost. It is critical that the facilities organization leadership understand all the options and models available. Additional information may be found in the BOK chapter, In-House Design and Construction.[21]
Ancillary, Athletics, and Auxiliary Considerations
An auxiliary unit is defined in Appendix B of the Postsecondary Education Facilities Inventory and Classification Manual (FICM) as “an entity that exists to furnish goods or services to students, faculty, or staff, and that charges a fee directly related to, although not necessarily equal to, the cost of the goods or services.”[22] In almost every state, there are rules, administrative codes, or guidance on the fiscal relationship between the facilities unit and the auxiliary, in addition to any university or college policy that the facilities leader needs to understand.
Some facilities departments are highly dependent on offset revenue received from providing facility services to auxiliary units, while others provide few, if any, services.
Human Resources and Information Technology
Facilities departments at the larger higher education institutions may have their own human resources unit, but regardless, every facilities department has a need for human resources services. The same holds true for information technology services. Any organizational structure has advantages and disadvantages, but facilities leadership must understand where these functions reside with respect to the budget and ensure that adequate resources are furnished to accomplish the goals.
Vacancies, Salary Savings, and Carry Forward
Every institution of higher education has different rules regarding vacancies, salary savings, and carry forward, and in some instances, states dictate the rules. Despite positions typically being budgeted for, rarely does every slot remain filled for the entire budget year; vacancies occur, and it takes time to fill positions. In addition, a new person may be hired at a lower salary than the incumbent earned. This difference becomes salary savings, which can be distributed in many ways, including retained centrally or returned to the unit to be used for salary adjustments.
If funds remain unexpended at the end of the fiscal year (carry forward), there may be institutional rules about how these are to be addressed at the year-end budget close. Some states and institutions allow budget over and under to be rolled forward into the next fiscal year; some allow a percentage, while others operate under a “use it or lose it” principle. Facilities leaders must be aware of the rules and policies at their institution.
Monitoring, Feedback, Adjusting
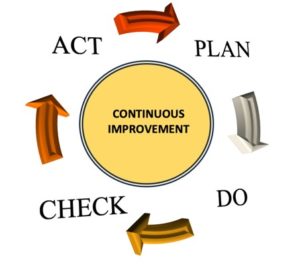
Once budget levels are set, it is critical to monitor performance. Fiscal performance is whether the budget is adhered to, and outcomes are what facilities delivers to the campus, i.e., whether the goals and objectives are met with respect to the APPA Service Levels. In all cases, the Plan, Do, Check, Act (PDCA) model can be used to adjust budget levels, expectations, or both continually. As it relates to the budgeting process:
Plan: Goals or APPA Service Levels are agreed to, resources are requested and allocated, budget categories are funded, and departments are staffed.
Do: With resource levels established, facilities provides services to faculty, staff, and students.
Check: Facilities continually monitors performance through a variety of methods. The most important and visible tools are the work order system with measures and metrics, inspections, customer service surveys, anecdotal feedback, and budget reports with variances.
Act or adjust: When results and outcomes differ from goals, adjustments are made. Funds can be moved or reallocated, and expectations may be raised or lowered. Then, the cycle repeats.
Inspections, Customer Surveys, and Anecdotal Feedback
Using inspections, facilities can calculate the actual service level and then compare it to the objectives and goals. This comparison can also be applied similarly to the custodial and grounds service levels. This slide is from APPA’s Operational Guidelines for Educational Facilities – Maintenance, 3rd Edition.
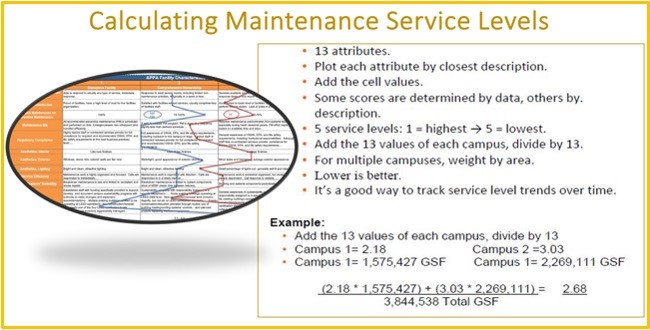
Figure 3: APPA Calculations from the Operational Guidelines
Customer service surveys and meetings can also be used to determine if goals and objectives are being met. Should performance fall short, investigate the “why.” There may be many other reasons besides inadequate funding and staffing levels.
Computerized Maintenance Management Systems and Performance Monitoring
Numerous computerized maintenance management systems (CMMS) can report measures and metrics that can then be used to gauge the performance of the facilities department. A CMMS can be very useful when establishing and monitoring budgets and performance. Detailed information may be found in the BOK chapter on Work Management.[23]
Financial Systems and Budget Monitoring
Institutions use a variety of budget systems, but in general, budgeting principles remain the same regardless of the systems employed. A budget is established, and a mechanism is put in place to track a process for adjustments. While each institution has business and fiscal policies, the budget summaries used to track progress are generally similar. There is a budget; within financial systems, encumbrances or commitments are funds that have been reserved when a purchase order has been issued to set aside the budget for the goods or services that will be received in the future. Once the amount is paid, it becomes an expense. Then, there is the balance remaining.
Additional information may be found in the BOK chapter, Financial Analysis and Control.[24]
Reading a Budget Summary
This example of a budget summary illustrates a few final important principal characteristics of higher education budgeting that facilities leaders should be aware of.
- The header provides information about the section of the overall budget.
- The account numbers or categories are down the left-hand side, and the expenditures are across the top, with the budget balance in the far right-hand column.
- The commitment (also called encumbrance) columns are blank, as this sheet is the labor budget, and there is no purchase order.
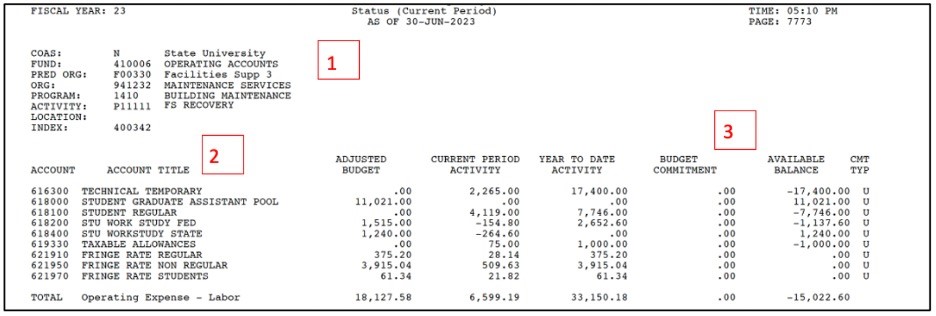
Figure 4: Sample Budget
- The next screenshot is from the materials portion of the budget. For all but the first line item, the beginning amounts read zero, and the ending balances show a negative number or deficit.
These line items are usually referred to as sub-accounts, and the funds are ultimately drawn from the “large budget pool” of $246,905.00 shown in the last screenshot.
There is usually a system option to load beginning amounts in each sub-account’s beginning “adjusted budget” if desired, such as was done with “Domestic Travel – non-team.” Decisions such as these typically follow institutional guidelines and are based on departmental needs. There is no “right” or “wrong” way, only the preferences of the budget managers, but facilities leaders should be aware of all options.
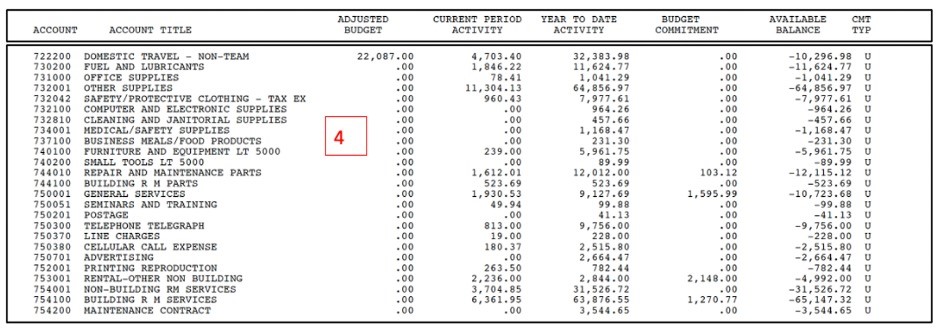
Figure 5: Sample Budget
- This practice of loading beginning amounts in each sub-account’s beginning “adjusted budget” may also be applied to other categories, such as training, that might have subcategories. This strategy gives the department flexibility to move money between subaccounts.
In addition, budget systems, managers, and policies differ on what happens when a line-item budget number is exceeded. Some systems are set up to not allow for any new expenditures, others allow the exceedance but generate an alert, and some will allow the department to “move money” from another budget line item to cover the overrun. Facilities leaders should be familiar with the process at their institutions.
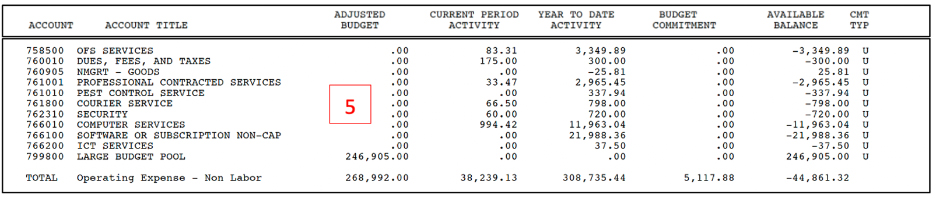
Figure 6: Sample Budget
Connecting the Dots
TopThe disruptive events of the last 30 years in higher education have led to a complete overhaul of university budgets. Yet most facilities management budgets remain steeped in historical resources. If budgets are to support institutions’ aspirations, resources must match the desired results. In addition, after the COVID-19 pandemic, most higher education institutions experienced an increased appetite for online education, and the drive to work remotely has led to a decrease in administrative personnel on campus. These developments result in fewer people on campus, impacting the facilities budget.
Be Realistic
While there are always incremental efficiencies, such as employing riding custodial and grounds equipment, doing more with less is not really possible; the outcome is generally less with less. Budgets must match the target service levels. Once targets are agreed upon and staffing and funding levels set, expectations should be communicated to the campus. The simplest example is the emptying of office trash— if the goal is once per week, this should be communicated to the campus constituents.
Adopt a “Can Do” Attitude
There is a tendency to generate reasons why work requests cannot be met when working with reduced resources, but this may be viewed as making excuses. The challenge is to find ways to meet customers’ needs. Managers should help staff prioritize their work with realistic due dates, and all personnel should communicate target completion dates to customers and then meet them.
Use the “Team” Approach
Employees should be encouraged to offer suggestions about how the team can best meet the campus needs. Where appropriate, managers should incorporate their suggestions into the budget. Encouraging employees to be part of the team that is working to meet the institution’s needs allows them to better understand and be more receptive if funds are reduced because of the budget control process.
You Are in Competition and Part of the Whole
The budgeting process is competitive and is basically a zero-sum game—university resources are finite. Each department competes for its share available to the institution, and each unit in the facilities organization competes with one another. Facilities employees should be prepared to justify or surrender resources.
Be sure any proposed budget is well thought out and properly substantiated. Supporting material is necessary and helpful, whether in the form of a professional report or graphical information documenting conditions for which funding is requested.
Facilities leaders, regardless of the scope of their responsibilities, must demonstrate leadership and the ability to meet stringent financial demands while maintaining a safe and attractive environment in which to teach and learn.
Best Practice
There is no substitute for what the best practice has always been: Identify the desired result, develop a plan (budget) to achieve that outcome, provide the resources to achieve that outcome, and measure performance. The APPA Bookstore, the APPA Body of Knowledge, and the APPA Operational Guidelines all contain valuable resources that can be used to develop a budget where resources and expectations match the aspirations of the institution.
Notes
Top[1] E. Kerr and S. Wood. “A Look at College Tuition Growth Over 20 Years,” U.S. News & World Report, (2023, September 13).
[2] CPI Inflation Calculator. (n.d.).
https://www.bls.gov/data/inflation_calculator.htm
[3] “The Lattice and the Ratchet.” Policy Perspectives, Vol. 2, No. 4, (1990).
http://media.johnlaudun.org.s3.amazonaws.com/wordpress/media/2016/03/DOC-2004Jan12-1073931090.pdf
[4] P. N. Friga. The Great Recession Was Bad for Higher Education. Coronavirus Could Be Worse. The Chronicle of Higher Education. (2020, March 24).
https://www.chronicle.com/article/the-great-recession-was-bad-for-higher-education-coronavirus-could-be-worse/?cid=gen_sign_in
[5] J. Moody. (2022, October 24). College Board report shows minimal tuition increases. Inside Higher Ed | Higher Education News, Events and Jobs.
https://www.insidehighered.com/news/2022/10/24/college-board-report-shows-minimal-tuition-increases
[6] Kim Parker and Juliana Menasce Horowitz. (March 9, 2022). “Majority of workers who quit a job in 2021 cite low pay, no opportunities for advancement, feeling disrespected”. Pew Research Center.
https://www.pewresearch.org/short-reads/2022/03/09/majority-of-workers-who-quit-a-job-in-2021-cite-low-pay-no-opportunities-for-advancement-feeling-disrespected/
[7] APPA. Effective and Innovative Practices Valparaiso University (Natural Gas and Med Voltage Distribution Systems), (n.d.).
https://www1.appa.org/membershipawards/documents/Valparaiso2009EIPEntry.pdf
[8] Facilities Services. About – Facilities Services. Facilities Services – Services for Education. (May 19, 2022).
[9] Public Private Partnership (P3) FAQs | Facilities | University of Idaho. (n.d.).
https://www.uidaho.edu/dfa/division-operations/utilities/p3-faq
[10] Marcela Rodrigues. A PERILOUS PACT, The U. of Iowa Leased Its Utilities Operations for $1 Billion. Now, Its Partner in the Deal Is Suing, (January 31, 2023).
[11] Steffon Gray. Responsibility Center Management and the COVID-19 Pandemic, NACUBO, (n.d.).
https://www.nacubo.org/-/media/Nacubo/Documents/prof_dev/RCM_V1.ashx
[12] J. Pickett. Responsibility Center Management at ISU, NACUBO, (n.d.).
https://www.nacubo.org/-/media/Nacubo/Documents/prof_dev/RCM_V1.ashx
[13] William G. Laird, CPA. Responsibility Center Management, Loyola University Chicago Case Study
NACUBO, (n.d.).
https://www.nacubo.org/-/media/Nacubo/Documents/prof_dev/RCM_V1.ashx
[14] Julie Tonneson. RCM at the University of Minnesota NACUBO, (n.d.).
https://www.nacubo.org/-/media/Nacubo/Documents/prof_dev/RCM_V1.ashx
[15] Strategic Sourcing | Procurement Services | UCI. (n.d.).
https://procurement.uci.edu/procurement/strategic-sourcing.php
[16] Strategic Sourcing | Procurement Services | UCI. (n.d.).
https://procurement.uci.edu/procurement/strategic-sourcing.php
[17] Glen Haubold, APPA Fellow and David Reynolds, P.E., CEFP. Budget Recharge, Cost Recovery, and Rates. APPA BOK: PART I: GENERAL ADMINISTRATION AND MANAGEMENT. (n.d.).
https://www.appa.org/bok/budget-recharge-cost-recovery-rates/
[18] Harvey Kaiser. Harvey H. Kaiser Associates Inc. Capital Renewal and Deferred Maintenance. APPA BOK: PART II: OPERATIONS AND MAINTENANCE. (2021, June 3).
https://www.appa.org/bok/capital-renewal-and-deferred-maintenance/
[19] Christina Hills and Ted Weidner. Fort Worth, Texas Operational Guidelines for Educational Facilities: Custodial, Grounds & Maintenance Trilogy, Marriage of Data & Trilogy Guidelines (January 10-12, 2023).
https://www1.appa.org/myappa/getfile.cfm?rid=99
[20] Ernest Hunter. APPA’s Operational Guidelines for Educational Facilities: A Focus on Staffing. Facility Manager Magazine. (JANUARY/FEBRUARY 2018).
https://www1.appa.org/FacilitiesManager/article.cfm?ItemNumber=4207&parentid=2726
[21] Samuel Bertolino, P.E., DBIA, CEFP, CRL. The Pennsylvania State University. In-House Design and Construction. APPA BOK: PART IV: PLANNING DESIGN CONSTRUCTION. (n.d.).
https://www.appa.org/bok/in-house-design-and-construction/
[22] Postsecondary Education Facilities Inventory and Classification Manual (FICM), Appendix B: Definitions of NACUBO and OMB Circular A-21 Functional Categories, NCES 2006-160 (May 2006).
https://nces.ed.gov/pubs2006/ficm/content.asp?ContentType=Appendix&appendix=B
[23] Mark Webb, EFP. University of Virginia. APPA BOK: PART II: OPERATIONS AND MAINTENANCE. (n.d.).
https://www.appa.org/bok/work-management/
[24] Mohammad Qayoumi, Ph.D., APPA Fellow. San José State University. Financial Analysis and Control. APPA BOK: PART I: GENERAL ADMINISTRATION AND MANAGEMENT
https://www.appa.org/bok/financial-analysis-and-control/#productivity-measurements